Nuclear Medicine
- Imaging and Radiooncology
- Clinical Cooperation Unit

Prof. Dr. Uwe Haberkorn
The Clinical Cooperation Unit Nuclear Medicine works on the planning and monitoring of therapies, the pharmacokinetic modeling of PET measurements, the identification of tumor-affine peptides, new endoradiotherapeutic approaches, alternating biopanning strategies and combinatorial therapies consisting of endoradiotherapy, chemotherapy, immunotherapy and radiotherapy as well as the development of new treatments for non-iodine-storing thyroid carcinomas.

Our Research
The CCU Nuclear Medicine deals with the planning and monitoring of chemotherapy or radiotherapy, the pharmacokinetic modeling of dynamic PET measurements, the identification of new peptides with high affinity to tumors, the establishment of new endoradiotherapeutic approaches based on peptides and antibodies, the development of new alternating biopanning strategies with phage and ribosome display and recombinant proteins, membrane fractions and cells, the development of combinatorial therapy approaches with endoradiotherapy and chemotherapy, immunotherapy and radiotherapy and the development of new therapies for non-iodine-storing thyroid carcinoma.
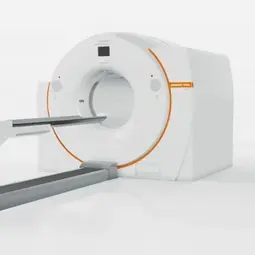
PET-CT Team
- Show profile

Prof. Dr. Antonia Dimitrakopoulou-Strauss
Group Leader
- Show profile

apl. Prof. Dr. Christos Sachpekidis
- Show profile
Dr. Leyun Pan
-

Heike Schmitt
Secretary
-

Carla Meitzner
-

Sergej Lossew
MTRA
-
Ömer Kilic
Selected Publications
Pan L, Sachpekidis C, Hassel J, Christopoulos P, Dimitrakopoulou-Strauss A
Sachpekidis C, Pan L, Groezinger M, Strauss DS, Dimitrakopoulou-Strauss A
John L, Poos AM, Brobeil A, Schinke C, Huhn S, Prokoph N, Lutz R, Wagner B, Zangari M, Tirier SM, Mallm JP, Schumacher S, Vonficht D, Solé-Boldo L, Quick S, Steiger S, Przybilla MJ, Bauer K, Baumann A, Hemmer S, Rehnitz C, Lückerath C, Sachpekidis C, Mechtersheimer G, Haberkorn U, Dimitrakopoulou-Strauss A, Reichert P, Barlogie B, Müller-Tidow C, Goldschmidt H, Hillengass J, Rasche L, Haas SF, van Rhee F, Rippe K, Raab MS, Sauer S, Weinhold N
Sachpekidis C, Enqvist O, Ulén J, Kopp-Schneider A, Pan L, Jauch A, Hajiyianni M, John L, Weinhold N, Sauer S, Goldschmidt H, Edenbrandt L, Dimitrakopoulou-Strauss A
Sachpekidis C, Pan L, Kopp-Schneider A, Weru V, Hassel JC, Dimitrakopoulou-Strauss A
Lopci E, Hicks RJ, Dimitrakopoulou-Strauss A, Dercle L, Iravani A, Seban RD, Sachpekidis C, Humbert O, Gheysens O, Glaudemans AWJM, Weber W, Wahl RL, Scott AM, Pandit-Taskar N, Aide N.
Strauss DS, Sachpekidis C, Kopka K, Pan L, Haberkorn U, Dimitrakopoulou-Strauss A
Sachpekidis C, Merz M, Kopp-Schneider A, Jauch A, Raab MS, Sauer S, Hillengass J, Goldschmidt H, Dimitrakopoulou-Strauss A
Anwar H, Sachpekidis C, Winkler J, Kopp-Schneider A, Haberkorn U, Hassel JC, Dimitrakopoulou-Strauss A
Kratochwil C, Giesel FL, López-Benítez R, Schimpfky N, Kunze K, Eisenhut M, Kauczor HU, Haberkorn U
Get in touch with us

