Methodological studies in static and dynamic PET
- 1. Comparison LAFOV and SAFOV
- 2. Shorter acquisition time & lower dose for static imaging
- 3. Dynamic PET/CT-Study of Quadra Scanner
- 4. Dynamic PET and kinetic modeling
- 5. Parametric Patlak imaging
- 6. Machine learning based 2-tissue compartment model parametric imaging
- 7. Artificial intelligence–based, volumetric assessment of the bone marrow metabolic activity
1. Comparison LAFOV and SAFOV
Long axial field of view (LAFOV) PET-CT scanners have an increased sensitivity as compared to Standard Axial Field of View (SAFOV) systems, which results in an increased lesion detectability.

Fig 1. Comparison mCT (60 min p.i.) / Quadra (120 min p.i.) 68Ga-DOTATOC: 20 – 40 times higher sensitivity as compared with Biograph mCT and 5-10 times as compared to Biograph Vision (Dimitrakopoulou-Strauss A et al. Eur J Nucl Med Mol Imaging 2023; 50:3354-3362)
2. Shorter acquisition time & lower dose for static imaging
The higher sensitivity allows a reduction in PET acquisition time and/or administered radiotracer dose, while it renders delayed scanning of satisfying diagnostic accuracy possible.
We evaluate different application doses and different time intervals for static imaging with different tracers. Some of the ongoing results are presented in Fig. 2. Although as a general trend the reduction of acquisition time was associated with a decrease of liver SNR and TBR, we could demonstrate that a 5-min static acquisition of the torso provides comparable diagnostic quality to standard lengths of acquisition
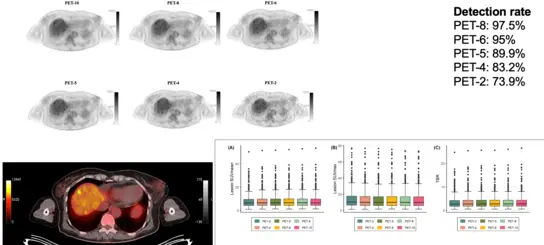
Fig 2. Application of the long axial field-of-view PET/CT with low-dose [18F]FDG in melanoma (Sachpekidis C et al. Eur J Nucl Med Mol Imaging 2023; 50:1158-1167)
3. Dynamic PET/CT-Study of Quadra Scanner
LAFOV systems allow for the first time whole body dynamic imaging with an ultrahigh temporal resolution. Fig 3a. demonstrates the ultrahigh temporal resolution of the LAFOV system.
Fig 3a. 98 Frames Dynamic PET images started with 75 Frames in 150 seconds

Fig 3b. Patient with multiple liver metastases from a primary lung tumor. Notably, some liver metastases can be delineated already 20 min after tracer injection.
4. Dynamic PET and kinetic modeling
Compartment modeling has its roots in pharmacology and biochemistry and has the goal to estimate biologically relevant parameters, which provide information about the pharmacokinetics of a radiotracer. It has been for several years used in PET for the characterization of tracer kinetics. The introduction of LAFOV PET-CT scanners has allowed for the first time the performance of whole-body pharmacokinetic studies, better temporal resolution, more robust IDIF calculation, and less noise in the TACs of the target and reference VOIs. This is particularly important for the assessment of new radiopharmaceuticals and evaluation of possible interactions between different organs.
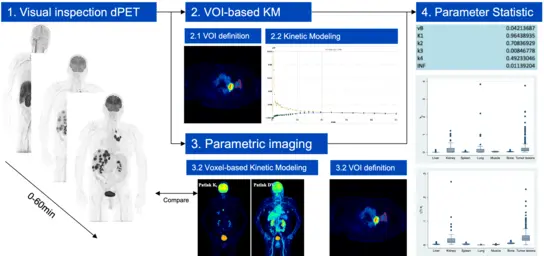
Fig 4. Dynamic PET and kinetic modelling workflow
5. Parametric Patlak imaging
Parametric imaging is a method of feature extraction allowing the visualization of an isolated parameter of a tracer’s kinetics based on dedicated mathematical models and a voxel-wise calculation, instead of a VOI-based analysis. The advantage in comparison to pharmacokinetic analysis is the direct visualization of different kinetic parameters, like tracer influx or transport rates (K1, k2 etc.), instead of providing their absolute numbers. New software tools provided for the LAFOV PET-CT scanners allow the so-called direct image reconstruction of Patlak images, which means that the Patlak algorithm is implemented into the reconstruction software and uses the sinogram. The reconstruction of parametric Patlak images additionally to static images has been used within research purposes mostly with [18F]-FDG. Two sets of images are calculated by this approach, the distribution volume (DV) images, which reflect the perfusion-related part of [18F]-FDG and the influx or Ki images, which reflect the phosphorylated part of the tracer.
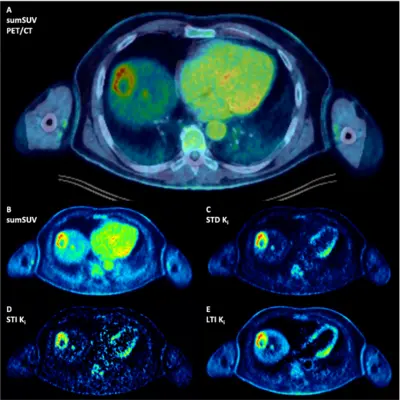
Fig 5a. Patient with multiple liver metastases from an uvea melanoma. A second small liver metastasis can be easily delineated in the parametric images due to the high contrast. (Pan L et al. Eur J Nucl Med Mol Imaging 2025; 52:623-637)
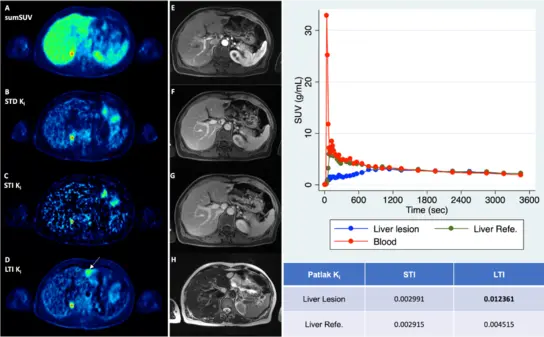
Fig 5b. Patient with multiple liver metastases from an uvea melanoma. The lesion in the left liver lobe, which is delineated in the parametric images is false positive due to a hemangioma.
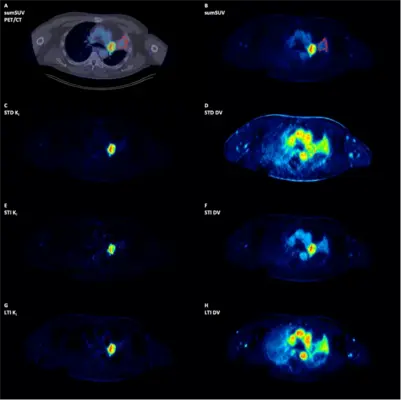
Fig 5c. Patient with a primary lung tumor and atelectasis. The parametric images demonstrate a clear delineation of the primary tumor from the atelectasis.
6. Machine learning based 2-tissue compartment model parametric imaging
Many known limitations of the compartment modeling approach still exist. Such a limitation is the fact that the assessment of the transport rates is operator-dependent due to the use of an iterative fitting to calculate the least squares between measured and model data, which may lead to overfitting problems and lack of reproducibility. The use of machine learning approaches will be still needed for robust and reproducible results that are user-independent for both VOI-based and pixel-wise quantitative analysis of PET data.
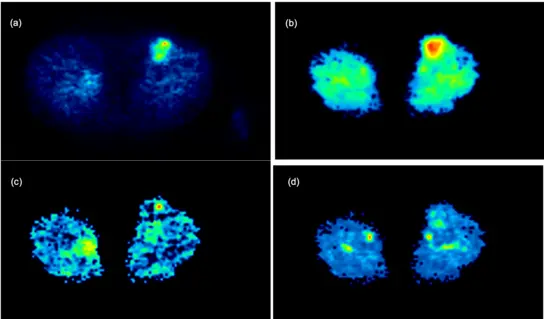
Fig 6. 2-Tissue Compartment Model Parametric Imaging in a patient with a soft tissue sarcoma of the left upper leg. The images demonstrate an increase of all microparameters of the FDG kinetics (Pan L et al. Phys Med Biol. 2017; 62:3566-3581).
7. Artificial intelligence–based, volumetric assessment of the bone marrow metabolic activity
In recent years, radiomics has emerged as an innovative method for high-throughput mining of image-derived features for clinical decision making, which may be particularly helpful in oncology. In addition, machine learning and deep learning, both subfields of artificial intelligence (AI) closely related to the radiomics process, have been increasingly applied to automated image analysis, offering new possibilities for the evaluation of imaging modalities such as CT, PET/CT and MRI in oncology. In line with this, the initial but steadily growing literature on the application of radiomics and AI-based methods in the field of [18F]FDG PET/CT in Multiple Myeloma has already yielded encouraging results, offering a potentially reliable tool towards optimization and standardization of interpretation in this disease.
Fig 7. showed image processing methodology for calculation of whole body MTV and TLG with application of the deep learning-based software tool. Myeloma lesions in the bone marrow compartment (red) are visualized on standard display of PET/CT (left). The lesions are calculated based on an AI-based bone segmentation in CT illustrated in the 3D image (second from the right) and appropriate SUV thresholds for each group of bones resulting in bone lesion segmentations illustrated in the 3D image to the right. The resulting lesion segmentation (red) can be used to compute total MTV and TLG for the patient.
Cooperation with Prof. Dr. Lars Edenbrandt, Department of Clinical Physiology, University Hospital, Gothenburg, Sweden and Department of Molecular and Clinical Medicine, Institute of Medicine, Sahlgrenska Academy, University of Gothenburg, Gothenburg, Sweden.

Fig 7. Artificial intelligence–based, volumetric assessment of the bone marrow metabolic activity in [18F]FDG PET/CT predicts survival in multiple myeloma (Sachpekidis C et al. Eur J Nucl Med Mol Imaging 2023; 50:3697-3708)